Solar Predictability Analysis
Understanding what governs forecasting difficulty, or predictability, is critical to improving solar nowcasting methods. Predictability can also inform solar site selection, as locations with similar solar resource potential may differ in how reliably their output can be forecast.
SolarBench enables systematic analysis of predictability across geographically distributed sites, diverse atmospheric conditions, and forecast horizons. We demonstrate this capability by examining two complementary questions:
- How can we quantify and compare forecasting difficulty across sites?
- How do different cloud regimes influence solar predictability?
Quantifying site-level predictability
Variability ≠ Predictability
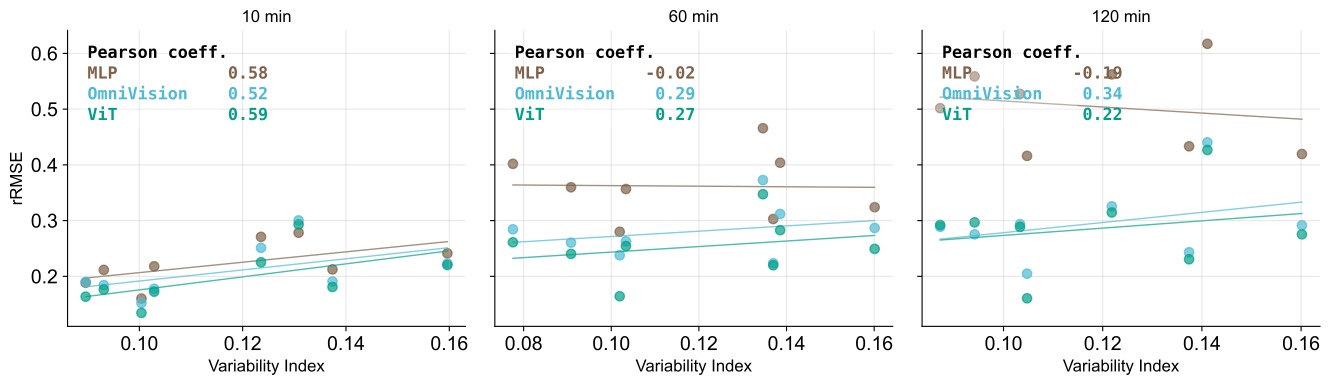
We examine whether the variability index, a commonly used measure of fluctuations in solar resources (see equation below), provides a useful indicator of forecasting difficulty. Its relationship with forecasting error is weak and inconsistent across sites and lead times. Therefore, variability alone is not a reliable indicator of predictability.

Here, kcs is the clear sky index and N and we use Δt = 5 min in this study.
Persistence error as a predictability indicator
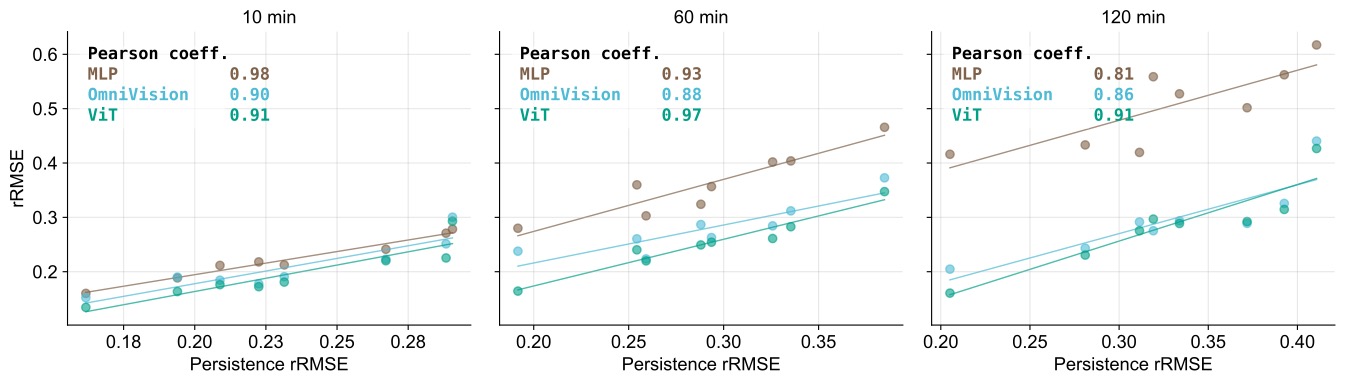
Persistence assumes that the current clear sky index remains constant over the forecast horizon. We use the relative root mean square error (rRMSE) of the persistence model as a proxy for forecasting difficulty. We find that persistence rRMSE shows strong and consistent correlations with deep learning forecasting errors, with Pearson correlation coefficients typically exceeding 0.85. It provides a simple, readily computed indicator of relative forecasting difficulty across diverse environments.
How cloud regime influences predictability
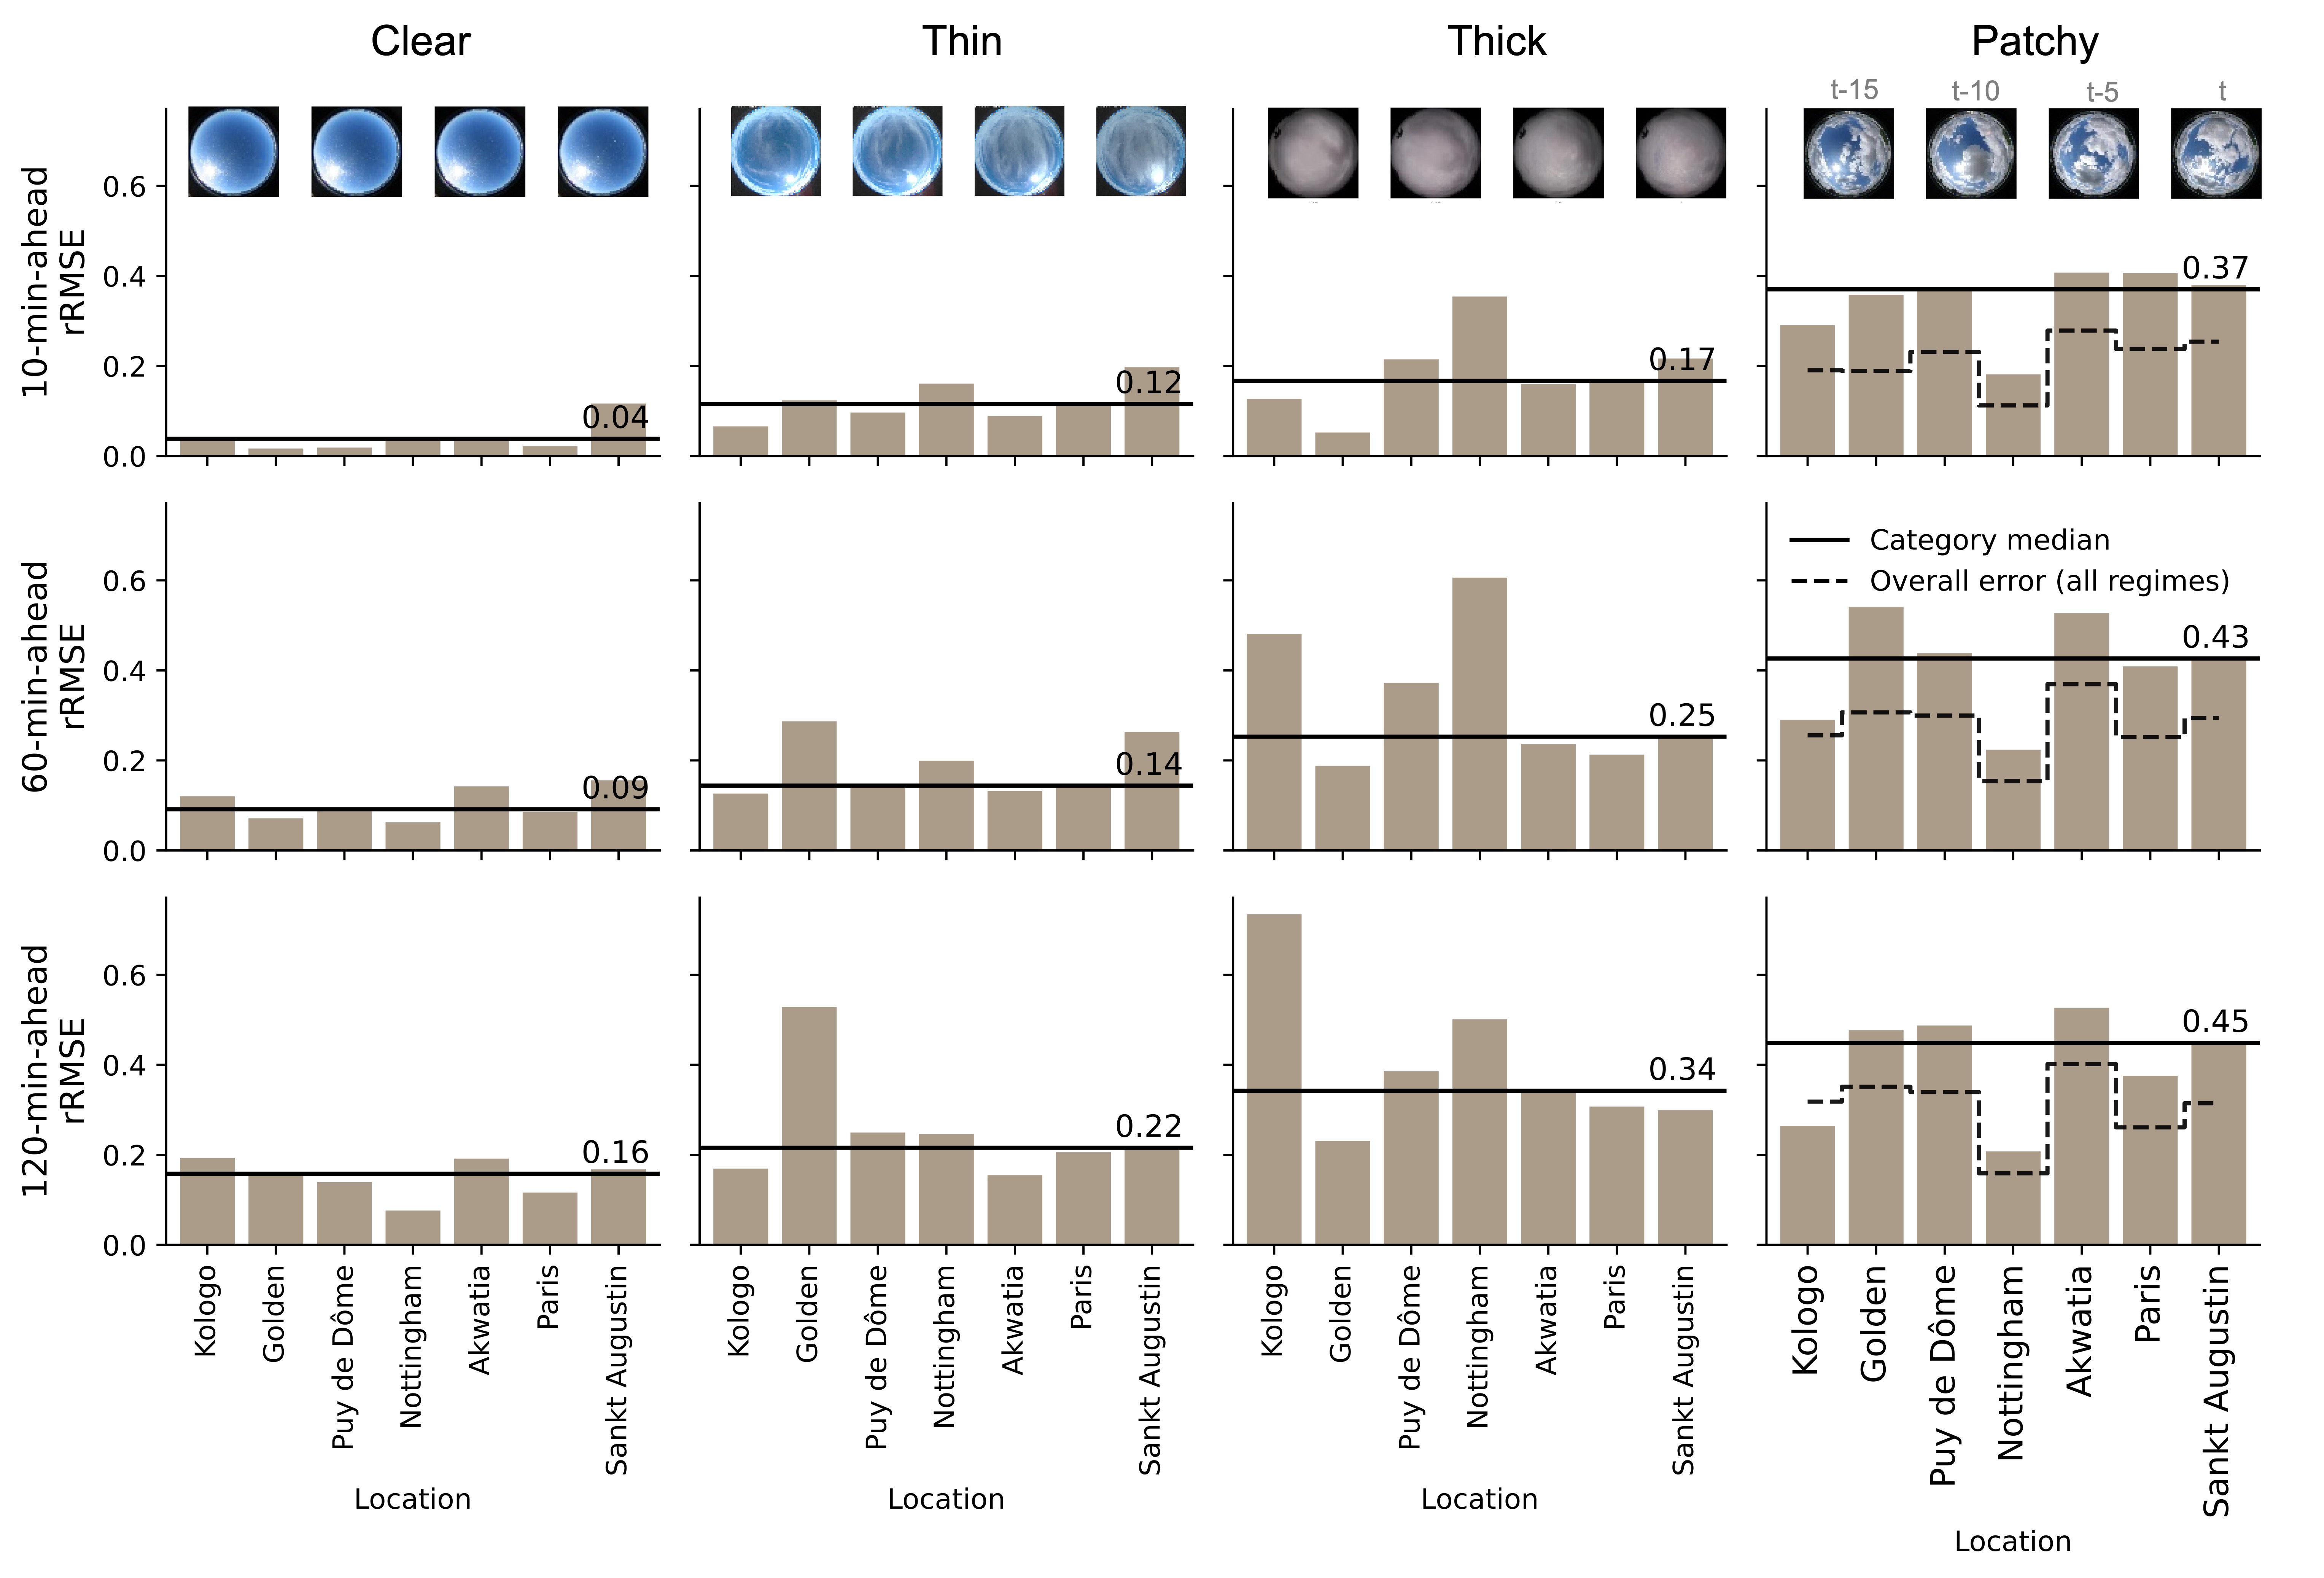
To explain systematic differences in predictability, we categorize cloud regimes as clear, thin, thick, or patchy based on the spatial structure and temporal evolution of cloud fields in historical sky image sequences. Regime descriptions and representative samples are shown below.
| Cloud regime | Description |
|---|---|
| Clear | Little or no visible cloud cover |
| Thin | High-level veil clouds or smooth, diffuse cloud layers that give the sky a milky appearance |
| Thick | Dense, continuous overcast cloud cover |
| Patchy | Broken or spatially heterogeneous cloud fields, potentially involving complex cloud motion and evolution |
For each site, up to 1,000 test samples are manually labeled using historical sky image sequences. Persistence rRMSE is then calculated separately for each location, cloud regime, and forecast horizon. Our analysis highlights two main findings:
Patchy clouds are generally the most challenging regime. Spatially heterogeneous and rapidly evolving patchy cloud fields tend to produce the highest forecasting errors. Across locations, overall predictability also broadly follows the difficulty observed under patchy-cloud conditions.
Patchy clouds warrant more targeted investigation. Distinguishing errors associated with cloud motion from those caused by complex cloud evolution may help identify where improved spatial context, cloud dynamics, or physical information is needed.
These findings demonstrate how SolarBench can support a deeper understanding of solar predictability and guide the development of forecasting methods tailored to challenging atmospheric conditions.